Plot significantly perturbed gene-sets as a network
plot_gs_network(
  normalisedScores,
  gsTopology,
  colorBy = NULL,
  foldGSname = TRUE,
  foldafter = 2,
  layout = c("fr", "dh", "gem", "graphopt", "kk", "lgl", "mds", "sugiyama"),
  edgeAlpha = 0.8,
  edgeWidthScale = c(0.5, 3),
  edgeLegend = FALSE,
  nodeSizeScale = c(3, 6),
  nodeShape = 16,
  showLegend = TRUE,
  gsLegTitle = NULL,
  gsNameSize = 3,
  gsNameColor = "black",
  plotIsolated = FALSE,
  maxOverlaps = 10,
  ...
)
Arguments
- normalisedScores
A
data.frameof pathway perturbation scores derived from thenormalise_by_permu()function- gsTopology
List of pathway topology matrices generated using function
retrieve_topology()- colorBy
Choose to color nodes either by robustZ or pvalue. A column must exist in the
normalisedScoresdata.framefor the chosen parameter- foldGSname
logical(1) Should long gene-set names fold across multiple lines
- foldafter
The number of words after which gene-set names should be folded. Defaults to 2
- layout
The layout algorithm to apply. Accept all layout supported by
igraph- edgeAlpha
numeric(1) Transparency of edges. Default to 0.8
- edgeWidthScale
A numerical vector of length 2 to be provided to
ggraph::scale_edge_width_continuous()for specifying the minimum and maximum edge widths after transformation. Defaults toc(0.5, 3)- edgeLegend
logical(1) Should edge weight legend be shown
- nodeSizeScale
A numeric vector of length 2 to be provided to
ggplot2::scale_size()for specifying the minimum and maximum node sizes after transformation. Defaulted toc(3,6)- nodeShape
Shape of nodes
- showLegend
logical(1) Should color legend be shown
- gsLegTitle
Optional title for the color legend
- gsNameSize
Size of node text labels
- gsNameColor
Color of node text labels
- plotIsolated
logical(1) Should nodes not connected to any other nodes be plotted. Defaults to FALSE
- maxOverlaps
passed to geom_node_text
- ...
Not used
Value
A ggplot2 object
Examples
load(system.file("extdata", "gsTopology.rda", package = "sSNAPPY"))
load(system.file("extdata", "normalisedScores.rda", package = "sSNAPPY"))
# Subset pathways significantly perturbed in sample R5020_N2_48
subset <- dplyr::filter(
normalisedScores, adjPvalue < 0.05, sample == "R5020_N2_48"
)
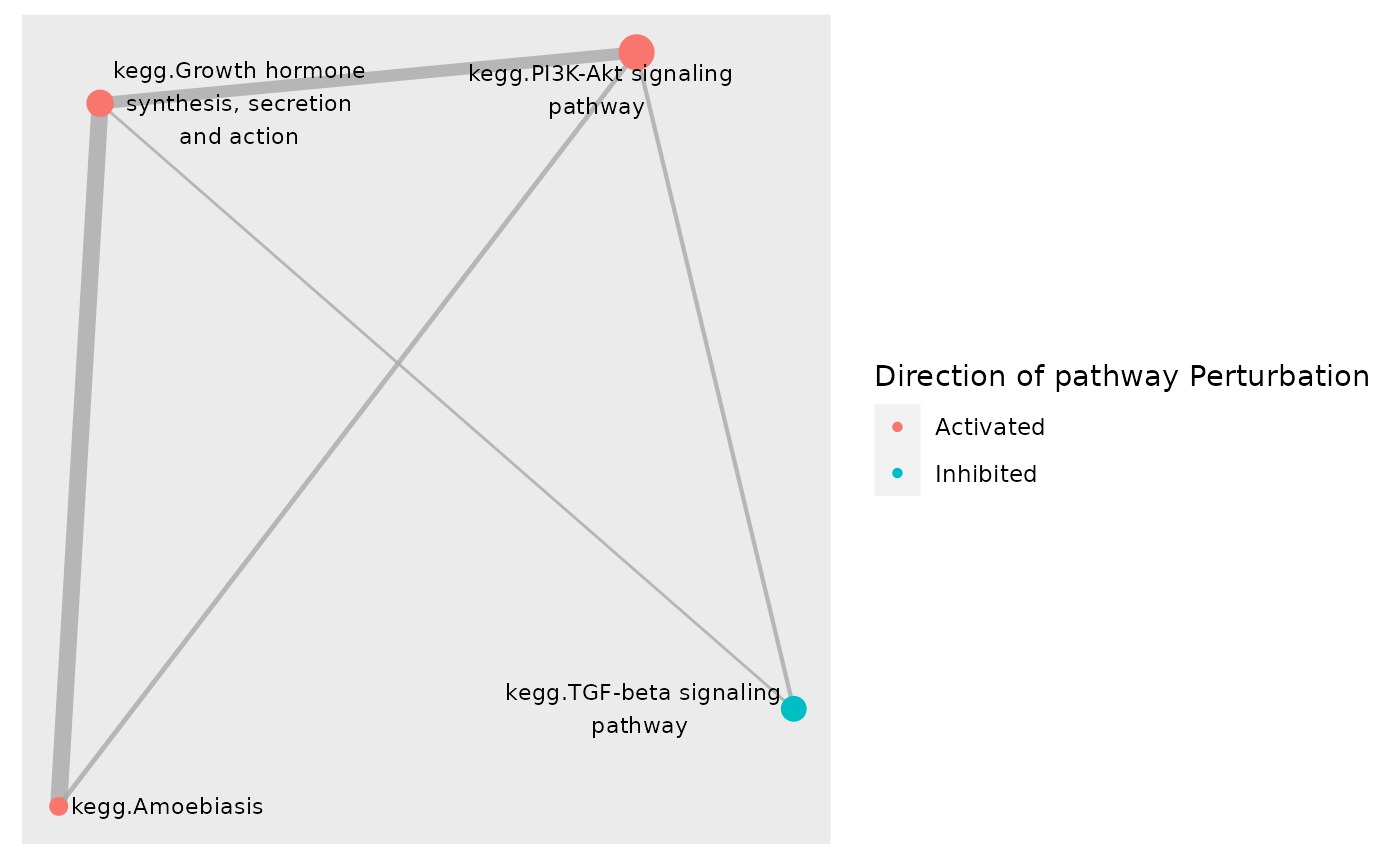
subset[["status"]] <- ifelse(subset[["robustZ"]]> 0, "Activated", "Inhibited")
# Color network plot nodes by status
plot_gs_network(subset, gsTopology,
colorBy = "status", layout = "dh",
gsLegTitle = "Direction of pathway Perturbation")
 # Color network plot nodes by p-values
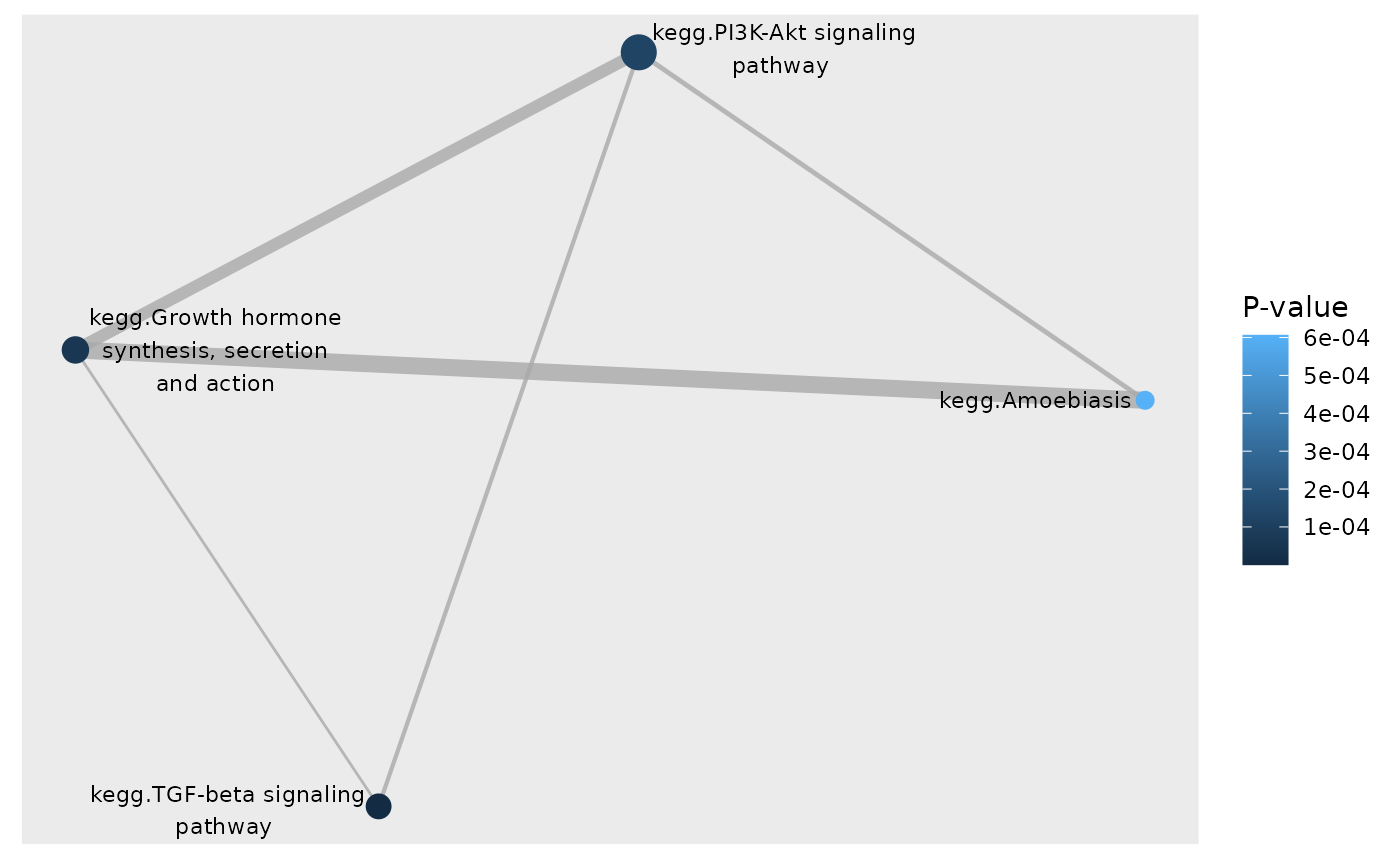
plot_gs_network(subset, gsTopology, layout = "dh",
colorBy = "pvalue", gsLegTitle = "P-value")
# Color network plot nodes by p-values
plot_gs_network(subset, gsTopology, layout = "dh",
colorBy = "pvalue", gsLegTitle = "P-value")