Plot pathways and genes contained in them as a network
plot_gs2gene(
  normalisedScores,
  gsTopology,
  geneFC = NULL,
  mapEntrezID = NULL,
  colorGsBy = NULL,
  foldGSname = TRUE,
  foldafter = 2,
  filterGeneBy = 2,
  layout = c("fr", "dh", "gem", "graphopt", "kk", "lgl", "mds", "sugiyama"),
  edgeColor = "darkgrey",
  edgeAlpha = 0.8,
  edgeArc = 0.5,
  geneNodeSize = 3,
  geneNodeShape = 17,
  geneNameFace = c("italic", "plain", "bold", "bold-italic"),
  geneNameColor = "grey30",
  geneNameSize = 3,
  labelGene = TRUE,
  gsNodeSize = 2,
  gsNodeShape = 21,
  gsNodeStroke = 0.5,
  gsNodeOutline = "white",
  gsNameSize = 6,
  gsNameColor = "black",
  geneLegTitle = "Mean logFC",
  gsLegTitle = colorGsBy,
  maxOverlaps = 10,
  ...
)
Arguments
- normalisedScores
A
data.framederived from thenormalise_by_permu()function. Only gene-sets of interest should be included- gsTopology
List of pathway topology matrices generated using function
retrieve_topology()- geneFC
An optional named vector of pathways' fold changes
- mapEntrezID
Optional. A
data.framematching genes' entrez IDs to another identifier with preferred labels. Must contain the columns:"entrezid"and"mapTo"- colorGsBy
Column within
normalisedScoresto color gene-set/pathway nodes by- foldGSname
logical. Should long gene-set names be folded into two lines- foldafter
The number of words after which gene-set names should be folded.
- filterGeneBy
Filtration cut-off applied to genes' connectivity (ie. how many pathways was a gene involved in).
- layout
The layout algorithm to apply. Accepts all layout supported by
igraph.- edgeColor, edgeAlpha
Color and transparency of edges
- edgeArc
The bend of edges. 1 approximates a semi-circle whilst 0 will give a straight line.
- geneNodeSize, geneNodeShape
Size and shape for gene nodes
- geneNameSize, geneNameColor, geneNameFace
Size, color and fontface to use for gene labels
- labelGene
logical(1)Should the gene names be included- gsNodeSize
Size for gene-set/pathway nodes
- gsNodeShape
Shape for gene-set/pathway nodes. Should be a shape with a fill parameter, such as 21:25
- gsNodeStroke, gsNodeOutline
Border thickness and color for gene-set/pathway nodes
- gsNameSize, gsNameColor
Size and color of gene-set/pathway labels
- geneLegTitle
character(1). Legend title for gene nodes- gsLegTitle
character(1)Legend title for gene-set/pathway nodes- maxOverlaps
passed to geom_node_text
- ...
Not used
Value
A ggplot2 object
Details
Taking the perturbation scores of a list of gene-sets derived from
normalise_by_permu() as input, this function matches gene-sets to
their associated genes by utilizing information from pathway topology matrices.
If providing logFC values as a named vector, the names must be entrezgene IDs
in the format of "ENTREZID:XXXX" for compatibility with the values returned
by retrieve_topology(). If not providing this vector, only genes associated
with two or more pathways will be added to the plot, however, it should be
noted that if omitting this vector, network plots can easily become
unmanageable.
Users can also choose to provide a mapEntrezID data.frame to match
entrezgene IDs to their chosen identifiers. The data.frame should contain
the columns: "entrezid" and "mapTo".
If geneFC is provided, gene nodes will be colored by values provided,
otherwise all gene nodes will drawn in grey.
Since some gene-sets could can contain hundreds of genes, it is not
recommended to plot all genes. If mapEntrezID data.frame is provided,
only genes included in that data.frame will be used in the plot.
It is strongly recommended to filter genes using some criteria, such as those
with the largest magnitude of change. If all pathway genes are desired,
please consider setting labelGene to FALSE to remove gene names.
Examples
load(system.file("extdata", "gsTopology.rda", package = "sSNAPPY"))
load(system.file("extdata", "normalisedScores.rda", package = "sSNAPPY"))
# Subset pathways significantly perturbed in sample R5020_N2_48
subset <- dplyr::filter(normalisedScores, adjPvalue < 0.05, sample == "R5020_N2_48")
subset$response <- ifelse(subset$robustZ > 0, "Activated", "Inhibited")
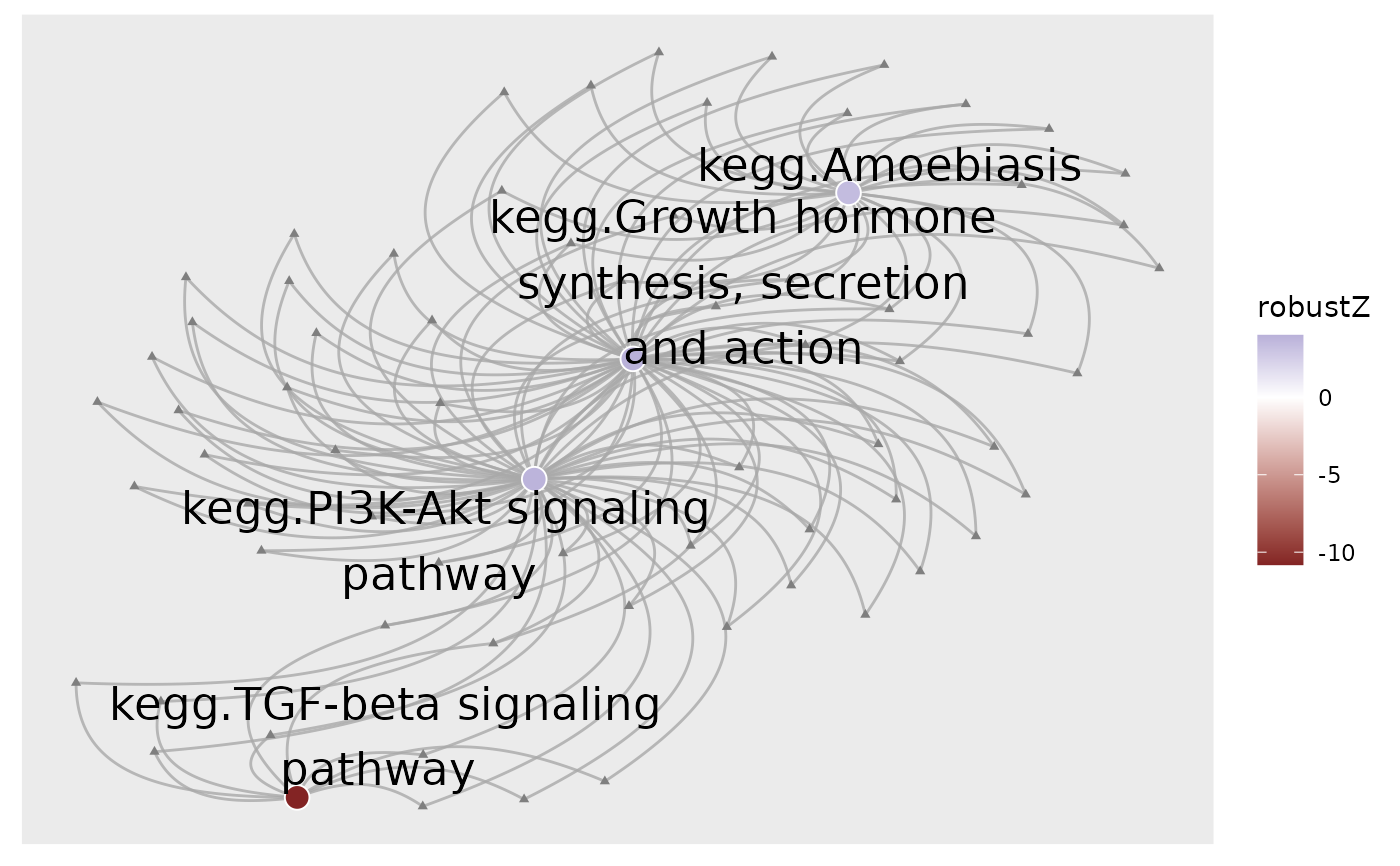
# Color gene-sets nodes by robust z-scores.
plot_gs2gene(
subset, gsTopology, colorGsBy = "robustZ", labelGene = FALSE, geneNodeSize = 1,
gsNodeSize = 4
) + scale_fill_gradient2()
#> Gene fold-changes were not provided as a named vector. All genes will be colored identically.
 # When fold-changes are not provided, gene nodes are colored grey.
# To color genes by their direction of change, firstly compute single-sample logFC
data(logCPM_example)
data(metadata_example)
metadata_example <- dplyr::mutate(metadata_example, treatment = factor(
treatment, levels = c("Vehicle", "E2+R5020", "R5020")))
ls <- weight_ss_fc(
logCPM_example, metadata = metadata_example,
groupBy = "patient", treatColumn = "treatment",
sampleColumn = "sample"
)
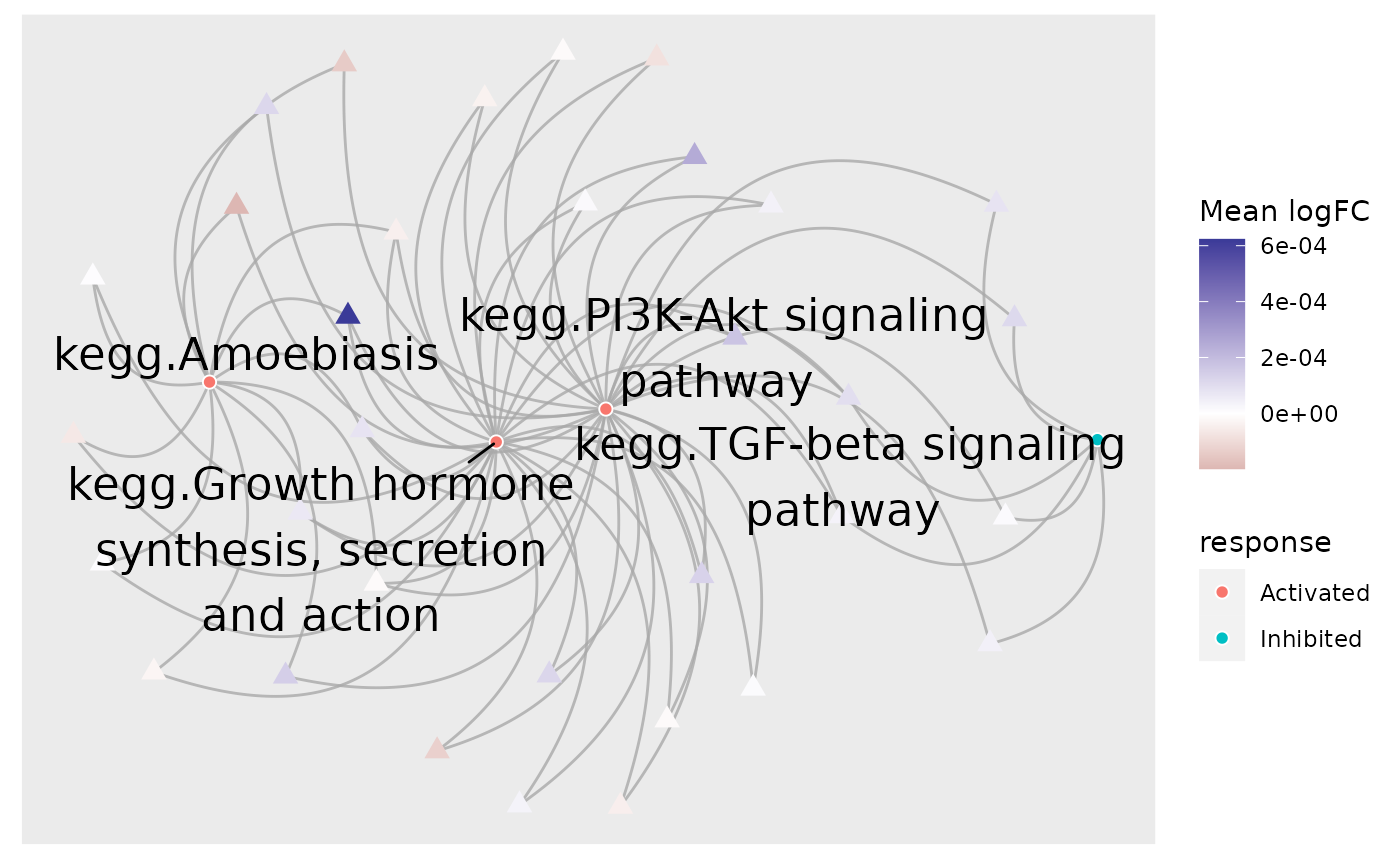
# Provide fold-changes of sample R5020_N2_48 as a named vector
plot_gs2gene(
subset, gsTopology, geneFC = ls$logFC[,"R5020_N2_48"],
colorGsBy = "response", labelGene = FALSE
) + scale_colour_gradient2()
# When fold-changes are not provided, gene nodes are colored grey.
# To color genes by their direction of change, firstly compute single-sample logFC
data(logCPM_example)
data(metadata_example)
metadata_example <- dplyr::mutate(metadata_example, treatment = factor(
treatment, levels = c("Vehicle", "E2+R5020", "R5020")))
ls <- weight_ss_fc(
logCPM_example, metadata = metadata_example,
groupBy = "patient", treatColumn = "treatment",
sampleColumn = "sample"
)
# Provide fold-changes of sample R5020_N2_48 as a named vector
plot_gs2gene(
subset, gsTopology, geneFC = ls$logFC[,"R5020_N2_48"],
colorGsBy = "response", labelGene = FALSE
) + scale_colour_gradient2()
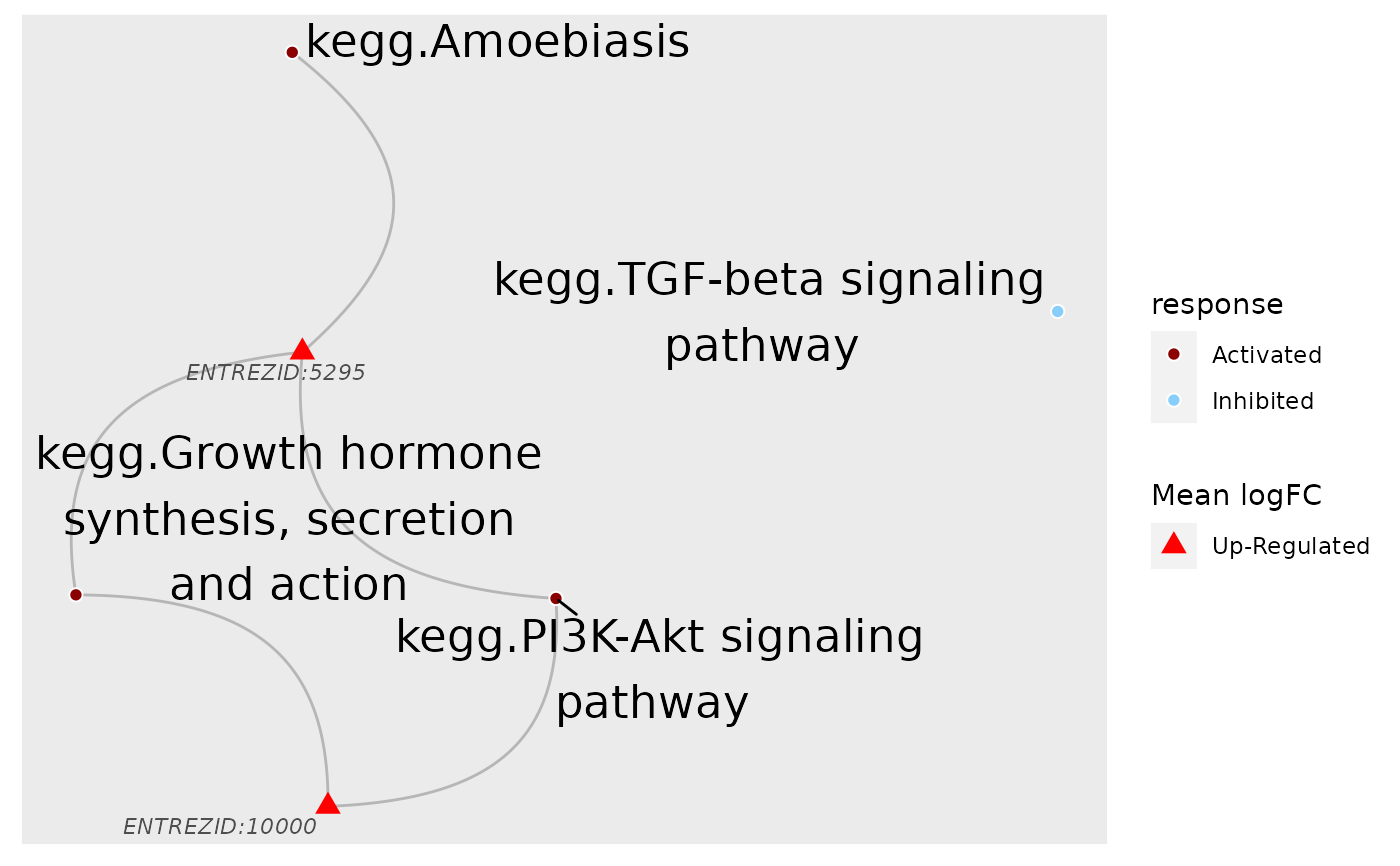
 # By default, the function only include genes involved in at least 2 pathways,
# which can be overwritten by the `filterGeneBy` parameter. But there are still
# a large number of genes, making the plot cumbersome. Instead, only include
# fold-changes of genes within the top 500 absolute values for fold-change
top500 <- rank(1/abs(ls$logFC[,"R5020_N2_48"])) <= 500
fcByDir <- ifelse(ls$logFC[top500,"R5020_N2_48"] > 0, "Up-Regulated", "Down-Regulated")
plot_gs2gene(subset, gsTopology, geneFC = fcByDir, colorGsBy = "response") +
scale_fill_manual(values = c("darkred", "lightskyblue")) +
scale_colour_manual(values = c("red", "blue"))
# By default, the function only include genes involved in at least 2 pathways,
# which can be overwritten by the `filterGeneBy` parameter. But there are still
# a large number of genes, making the plot cumbersome. Instead, only include
# fold-changes of genes within the top 500 absolute values for fold-change
top500 <- rank(1/abs(ls$logFC[,"R5020_N2_48"])) <= 500
fcByDir <- ifelse(ls$logFC[top500,"R5020_N2_48"] > 0, "Up-Regulated", "Down-Regulated")
plot_gs2gene(subset, gsTopology, geneFC = fcByDir, colorGsBy = "response") +
scale_fill_manual(values = c("darkred", "lightskyblue")) +
scale_colour_manual(values = c("red", "blue"))
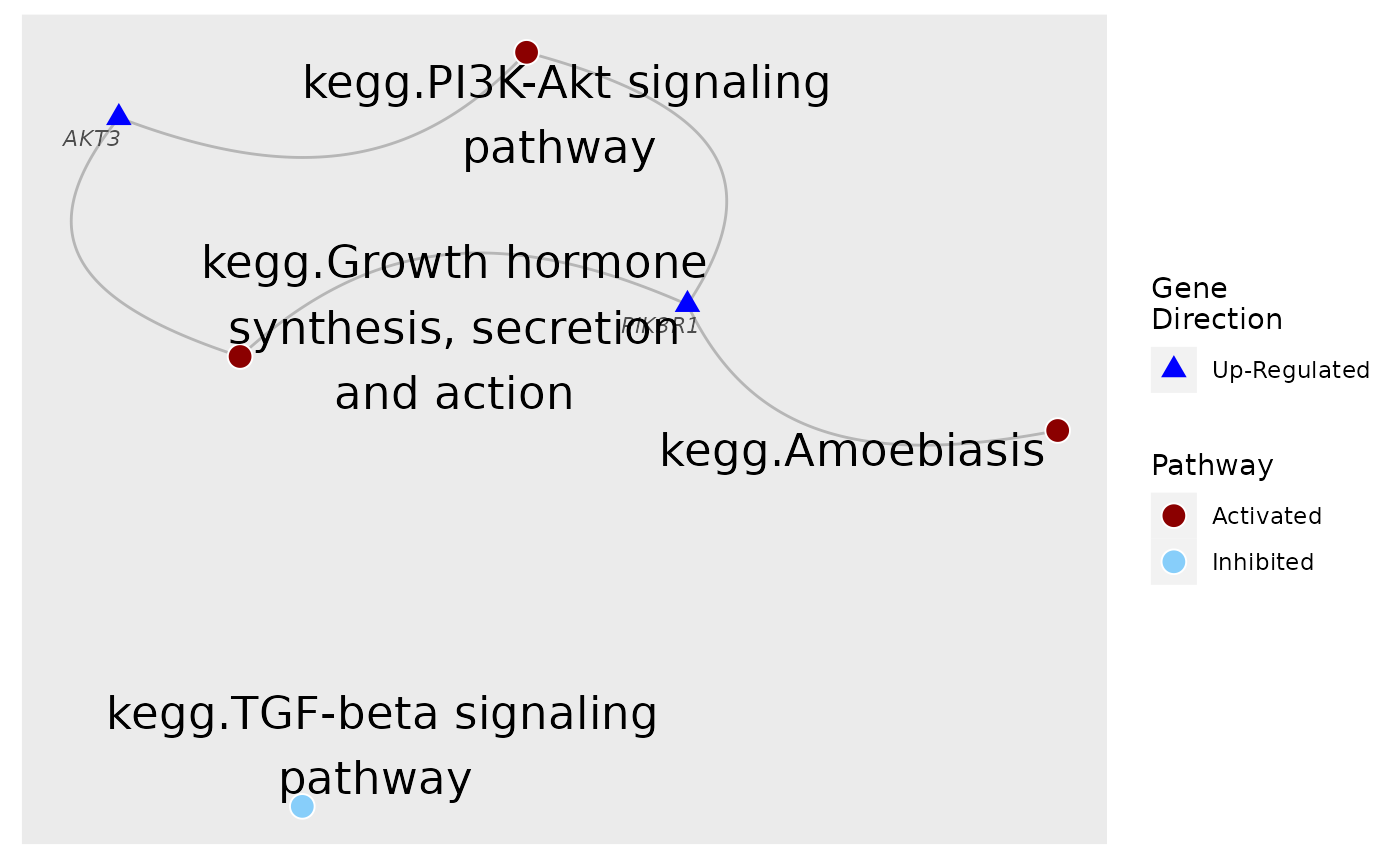
 # To make the gene labels more informative, map genes' entrez id to chosen identifiers.
load(system.file("extdata", "entrez2name.rda", package = "sSNAPPY"))
plot_gs2gene(
subset, gsTopology, geneFC = fcByDir, mapEntrezID = entrez2name,
colorGsBy = "response", gsNodeSize = 4
) +
scale_fill_manual(values = c("darkred", "lightskyblue"), name = "Pathway") +
scale_colour_manual(values = c("blue", "red"), name = "Gene\nDirection")
# To make the gene labels more informative, map genes' entrez id to chosen identifiers.
load(system.file("extdata", "entrez2name.rda", package = "sSNAPPY"))
plot_gs2gene(
subset, gsTopology, geneFC = fcByDir, mapEntrezID = entrez2name,
colorGsBy = "response", gsNodeSize = 4
) +
scale_fill_manual(values = c("darkred", "lightskyblue"), name = "Pathway") +
scale_colour_manual(values = c("blue", "red"), name = "Gene\nDirection")