Visualise the community structure in significantly perturbed gene-set network
Source:R/plot_community.R
plot_community.RdVisualise the community structure in significantly perturbed gene-set network
plot_community(
  normalisedScores,
  gsTopology,
  gsAnnotation = NULL,
  colorBy = "community",
  communityMethod = c("louvain", "walktrap", "spinglass", "leading_eigen",
    "edge_betweenness", "fast_greedy", "label_prop", "leiden"),
  foldGSname = TRUE,
  foldafter = 2,
  layout = c("fr", "dh", "gem", "graphopt", "kk", "lgl", "mds", "sugiyama"),
  markCommunity = "ellipse",
  markAlpha = 0.2,
  color_lg_title = NULL,
  edgeAlpha = 0.8,
  scale_edgeWidth = c(0.5, 3),
  edgeLegend = FALSE,
  scale_nodeSize = c(3, 6),
  nodeShape = 16,
  lb_size = 3,
  lb_color = "black",
  plotIsolated = FALSE,
  ...
)
Arguments
- normalisedScores
A
data.framederived from normalise_by_permu- gsTopology
List of pathway topology matrices generated using retrieve_topology
- gsAnnotation
A
data.framecontaining gene-sets categories for pathway annotation. Must contain the two columns:c("gs_name", "category"), wheregs_namedenotes gene-sets names that are matched to names of pathway topology matrices, andcategoryrecords a higher level category for each pathway. If customized annotation is not provided, it will be assumed that the pathways were obtained from the KEGG database and inbuilt KEGG pathway annotation information will be used- colorBy
Can be any column with in the
normalisedScoresobject, or the additional value "community".- communityMethod
A community detection method supported by
igraph. See details for all methods available.- foldGSname
logical. Should long gene-set names be folded into two lines- foldafter
The number of words after which gene-set names should be folded. Defaults to 2
- layout
The layout algorithm to apply. Accepted layouts are
"fr", "dh", "gem", "graphopt", "kk", "lgl", "mds" and "sugiyama"- markCommunity
characterAgeom_mark_*method supported byggforceto annotate sets of nodes belonging to the same community. Either*NULL*, *ellipse*, *circle*, *hull*, *rect*- markAlpha
Transparency of annotation areas.
- color_lg_title
Title for the color legend
- edgeAlpha
Transparency of edges.
- scale_edgeWidth
A numerical vector of length 2 to be provided to
ggraph::scale_edge_width_continuous()for specifying the minimum and maximum edge widths after transformation.- edgeLegend
logicalShould edge weight legend be shown- scale_nodeSize
A numerical vector of length 2 to be provided to
ggplot2::scale_size()for specifying the minimum and maximum node sizes after transformation.- nodeShape
The shape to use for nodes
- lb_size
Size of node text labels
- lb_color
Color of node text labels
- plotIsolated
logical(1)Should nodes not connected to any other nodes be plotted. Defaults to FALSE- ...
Used to pass various potting parameters to
ggforce::geom_mark_*()
Value
A ggplot2 object
Details
A community detection strategy specified by communityMethod will
be applied to the pathway-pathway network, and communities will be annotated
with the pathway category that had the highest number of occurrence,
denoting the main biological processes perturbed in that community.
At the moment, only KEGG pathway categories are provided with the
package, so if the provided normalisedScores contains perturbation
scores of pathways derived from other databases, annotation of communities
will not be performed unless pathway information is provided through
the gsAnnotation object. The category information needs to be
provided in a data.frame containing gs_name (gene-set names) and
category (categorising the given pathways).
Plotting parameters accepted by geom_mark_* could be passed to the
function to adjust the annotation area or the annotation label. See
geom_mark_ellipse for more details.
Examples
load(system.file("extdata", "gsTopology.rda", package = "sSNAPPY"))
load(system.file("extdata", "normalisedScores.rda", package = "sSNAPPY"))
#Subset the first 10 rows of the normalisedScores data.frame as an example
subset <- normalisedScores[1:15,]
subset$status <- ifelse(subset$robustZ > 0, "Activated", "Inhibited")
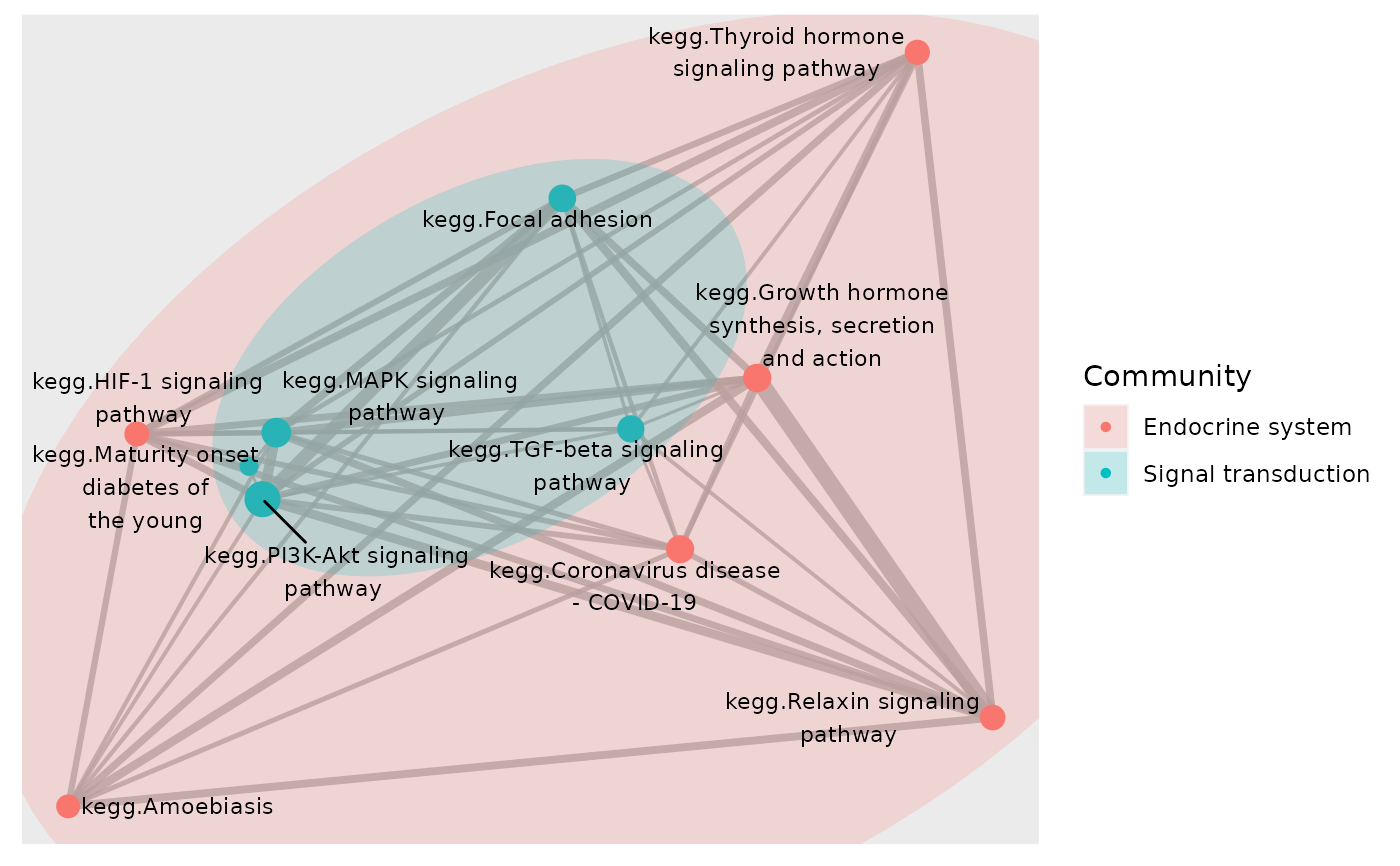
# Color network plot nodes by the community they were assigned to and mark
# nodes belonging to the same community by ellipses
plot_community(subset, gsTopology, colorBy = "community",layout = "kk",
color_lg_title = "Community")
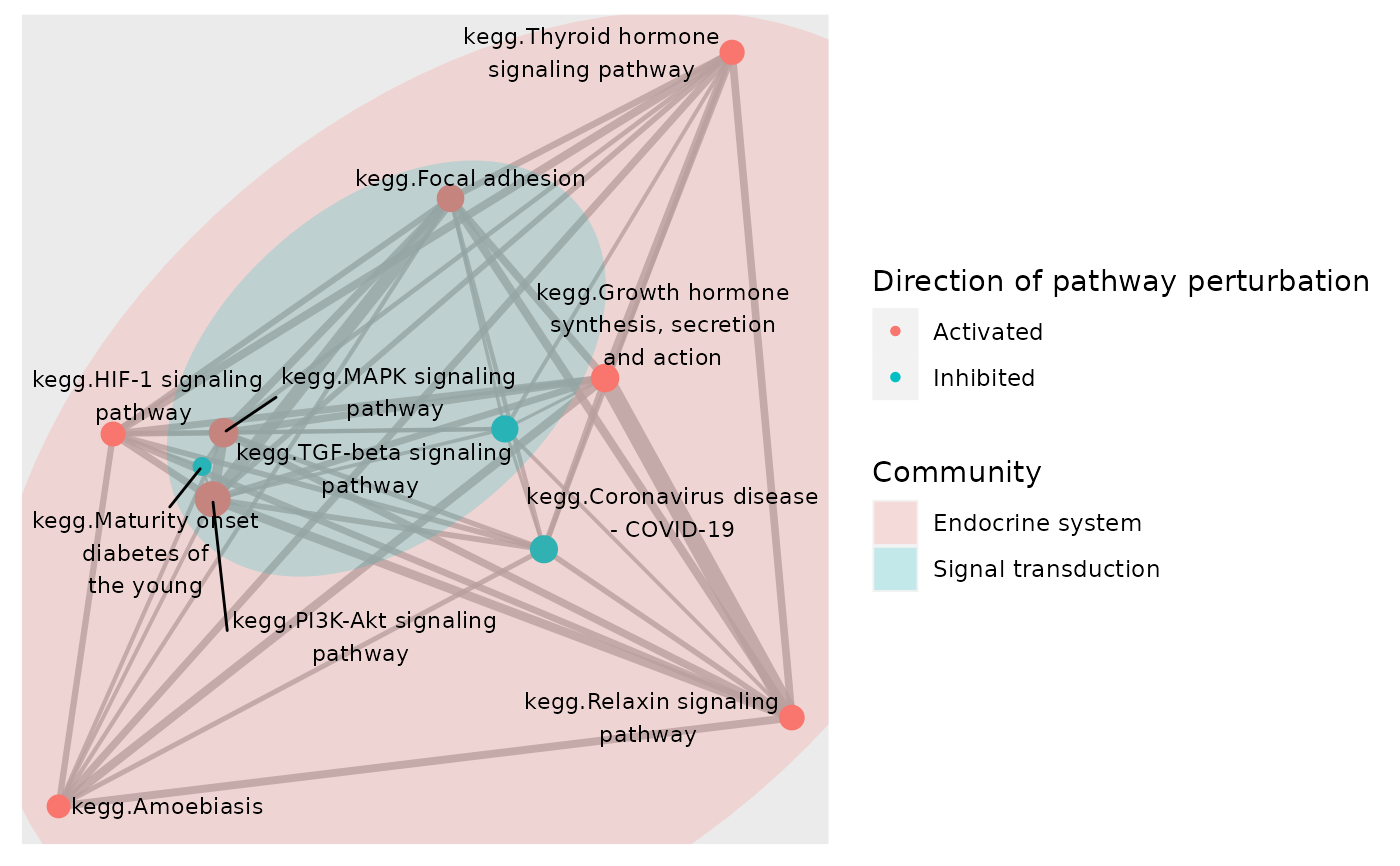
 # Color network plot nodes by pathways' directions of changes and mark nodes
# belonging to the same community by ellipses
plot_community(subset, gsTopology, colorBy = "status",layout = "kk",
color_lg_title = "Direction of pathway perturbation")
# Color network plot nodes by pathways' directions of changes and mark nodes
# belonging to the same community by ellipses
plot_community(subset, gsTopology, colorBy = "status",layout = "kk",
color_lg_title = "Direction of pathway perturbation")
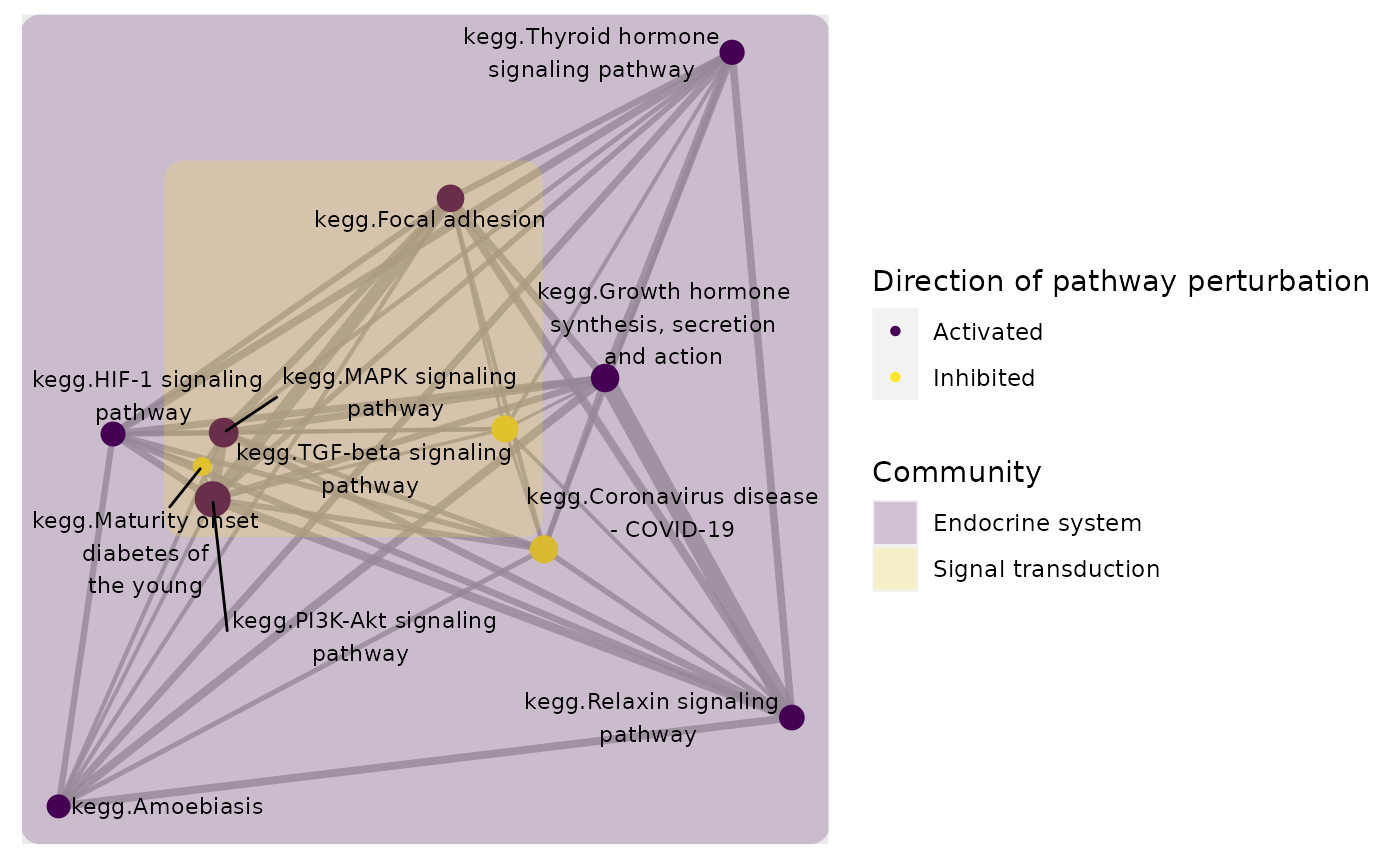
 # To change the colour and fill of `geom_mark_*` annotation, use any
# `scale_fill_*` and/or `scale_color_*`
# functions supported by `ggplot2`. For example:
p <- plot_community(subset, gsTopology, colorBy = "status",layout = "kk",
markCommunity = "rect",color_lg_title = "Direction of pathway perturbation")
p + ggplot2::scale_color_ordinal() + ggplot2::scale_fill_ordinal()
# To change the colour and fill of `geom_mark_*` annotation, use any
# `scale_fill_*` and/or `scale_color_*`
# functions supported by `ggplot2`. For example:
p <- plot_community(subset, gsTopology, colorBy = "status",layout = "kk",
markCommunity = "rect",color_lg_title = "Direction of pathway perturbation")
p + ggplot2::scale_color_ordinal() + ggplot2::scale_fill_ordinal()